 |
| 
EdgeSight Reports - EdgeSight reports provide an in-depth view into an environment's current performance. Reporting in the EdgeSight Server Console is divided into the following categories:
Troubleshooting Reports - Troubleshooting reports provide you with detailed information, such as overviews of end user devices, application failure details, and process-related statistics. This information will allow you to easily diagnose issues in your virtual environment.
Example: Troubleshooting Report - Issue: End users complain that their virtual desktops are performing slow.
Report: ICA Session Round-Trip Time
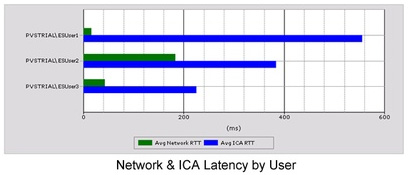
Description: This report provides detailed information on both network round-trip times and ICA round-trip times. The details in the ICA round-trip section better reflect end users' experiences with a virtual desktop.
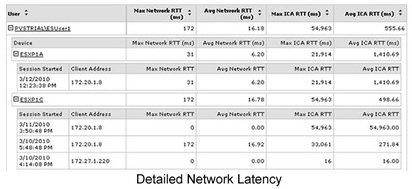
As seen in the Network & ICA Latency by User report, different end users can experience different response times. ESUser1 has nearly 600ms of perceived ICA latency, although the network latency is almost non-existent. This indicates an issue with the virtual desktop delivering information across ICA, such as a lack of CPU or memory resources. Further details about ESUser1's session, such as the time the end user experienced the issue, can be gathered by clicking the specific end user's graph in the report, as seen in the Detailed Network Latency report.
Monitoring Reports
Proactive monitoring of a virtual environment can help identify issues before they become major problems. The information found in the Monitoring reports provides a real-time overview of the environment and can be used to configure baseline values for alerts and actions.
Example: Monitoring Report - Issue: End users complain about long logon times.
Report: Session Client and Server Startup
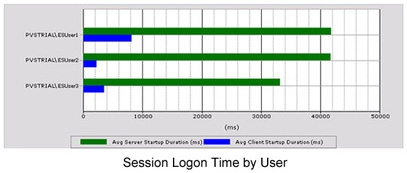
Description: This report provides an overview of end user or device logon times.
As seen in the Session Logon Time by User report, logon times average between 32 and 42 seconds. Clicking a specific end user's graph in the report provides additional details that can help you evaluate an end user's startup process.
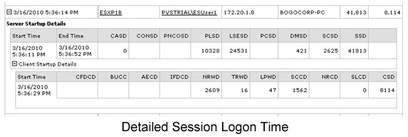
Using the information in the Detailed Session Logon Time report, you can determine that ESUser1's profile load time and login script execution time took the longest during the startup process. To reduce the startup time, you can look into reducing ESUser1's profile size by configuring folder redirection, or implementing Citrix Profile management.
For more information and a full description of the components listed in the Session Client and Server Startup report, see Citrix article CTX124851
Planning and Managing Reports - Planning and Managing reports are used to help plan when additional resources are required for an environment.
Example: Planning and Managing Report - Issue: You notice that end user sessions and XenApp servers are not responding.
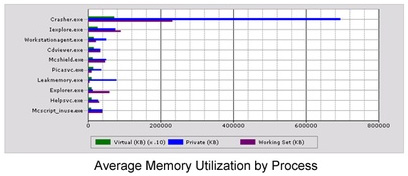
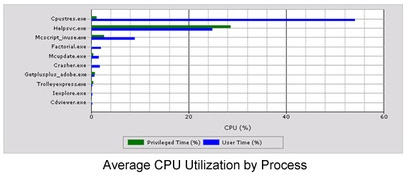
Report: Process Stability and Process Summary
Description: This report provides information, such as memory and CPU utilization, for each application installed on a virtual desktop. By reviewing how certain applications work in a XenDesktop environment, you will be able to determine whether end users that require access to memory- or CPU-intensive applications need more resources allocated to them.
- Troubleshooting
- Monitoring
- Planning and Managing
Troubleshooting Reports - Troubleshooting reports provide you with detailed information, such as overviews of end user devices, application failure details, and process-related statistics. This information will allow you to easily diagnose issues in your virtual environment.
Example: Troubleshooting Report - Issue: End users complain that their virtual desktops are performing slow.
Report: ICA Session Round-Trip Time
Description: This report provides detailed information on both network round-trip times and ICA round-trip times. The details in the ICA round-trip section better reflect end users' experiences with a virtual desktop.
As seen in the Network & ICA Latency by User report, different end users can experience different response times. ESUser1 has nearly 600ms of perceived ICA latency, although the network latency is almost non-existent. This indicates an issue with the virtual desktop delivering information across ICA, such as a lack of CPU or memory resources. Further details about ESUser1's session, such as the time the end user experienced the issue, can be gathered by clicking the specific end user's graph in the report, as seen in the Detailed Network Latency report.
Monitoring Reports
Proactive monitoring of a virtual environment can help identify issues before they become major problems. The information found in the Monitoring reports provides a real-time overview of the environment and can be used to configure baseline values for alerts and actions.
Example: Monitoring Report - Issue: End users complain about long logon times.
Report: Session Client and Server Startup
Description: This report provides an overview of end user or device logon times.
As seen in the Session Logon Time by User report, logon times average between 32 and 42 seconds. Clicking a specific end user's graph in the report provides additional details that can help you evaluate an end user's startup process.
Using the information in the Detailed Session Logon Time report, you can determine that ESUser1's profile load time and login script execution time took the longest during the startup process. To reduce the startup time, you can look into reducing ESUser1's profile size by configuring folder redirection, or implementing Citrix Profile management.
For more information and a full description of the components listed in the Session Client and Server Startup report, see Citrix article CTX124851
Planning and Managing Reports - Planning and Managing reports are used to help plan when additional resources are required for an environment.
Example: Planning and Managing Report - Issue: You notice that end user sessions and XenApp servers are not responding.
Report: Process Stability and Process Summary
Description: This report provides information, such as memory and CPU utilization, for each application installed on a virtual desktop. By reviewing how certain applications work in a XenDesktop environment, you will be able to determine whether end users that require access to memory- or CPU-intensive applications need more resources allocated to them.